How to Use the Windows 10 Resource Monitor: Analyze System Performance
Unlock Peak Performance: Mastering the Windows 10 Resource Monitor
Hey there, tech enthusiasts! Ever feel like your trusty Windows 10 machine is running through molasses? You click, you wait… you wait some more. It's like watching paint dry, only less exciting. We've all been there. Maybe you've got a gazillion browser tabs open (guilty!), or perhaps some rogue app is hogging all the resources. Whatever the reason, a sluggish PC can be a real productivity killer. But fear not, my friends, because today we're diving deep into a powerful, yet often overlooked, tool that's built right into Windows 10: the Resource Monitor.
Think of the Resource Monitor as your computer's personal physician, ready to diagnose what ails it. It's not some fancy, complicated piece of software you need to download and pay for. Nope, it's been hiding in plain sight all along, waiting for you to unleash its diagnostic powers. You see, Windows 10 is a complex beast, a symphony of hardware and software working (hopefully!) in harmony. But sometimes, things go awry. One component – your CPU, memory, disk, or network – might be working overtime, causing bottlenecks and slowing everything down. Identifying that bottleneck is the key to restoring your PC's pep.
Maybe you've noticed your computer fan spinning up like a jet engine every time you open a certain program. Or perhaps your games are stuttering and lagging, even though your graphics card should be more than capable. These are classic symptoms of resource contention, where different programs are fighting for the same limited resources. Without the Resource Monitor, you're essentially flying blind, guessing at the cause of the problem. You might end up throwing money at unnecessary upgrades, like buying more RAM when the real culprit is a runaway process hogging your CPU. Trust me; I’ve seen it happen!
So, why do so many people ignore the Resource Monitor? Well, it's not exactly the most glamorous tool in the Windows arsenal. It lacks the flashy graphics and user-friendly interface of some other performance monitoring programs. It can look a bit…intimidating at first glance. But don’t let its utilitarian appearance fool you. Beneath the surface lies a wealth of information that can help you troubleshoot performance issues, optimize your system, and even prevent future problems. It's like having a secret weapon in your fight against sluggishness.
We’ve all experienced that moment of panic when our computer freezes up right before a deadline. It's the digital equivalent of a heart attack! Wouldn't it be great to have a tool that could help you identify the potential causes of these crashes and prevent them from happening in the first place? That's precisely what the Resource Monitor can do. By tracking resource usage over time, you can identify patterns and anomalies that might indicate underlying problems. Maybe a certain program is gradually consuming more and more memory, suggesting a memory leak. Or perhaps your hard drive is constantly being accessed, even when you're not actively using it, hinting at a background process gone rogue.
Think of it as detective work. You're investigating the crime scene of your computer's performance, and the Resource Monitor is your magnifying glass, helping you uncover the clues and solve the mystery. And the best part? It's free! It's already there, waiting to be used. So, ditch the guesswork, stop throwing money at random upgrades, and let's get our hands dirty with the Windows 10 Resource Monitor. Ready to unlock the secrets of your system's performance and banish sluggishness forever? Keep reading, because we're about to embark on a journey of discovery, one resource at a time!
How to Use the Windows 10 Resource Monitor: Analyze System Performance
Alright, let's get down to business! The Resource Monitor might seem daunting at first, but trust me, it's easier to use than you think. We'll break it down step-by-step, so you can start diagnosing your system's performance issues like a pro.
Accessing the Resource Monitor
There are several ways to launch the Resource Monitor, pick whichever you find easiest:
• From the Task Manager: Press Ctrl+Shift+Esc to open Task Manager. Then, click on the "Performance" tab. At the bottom of the window, you'll see a link that says "Open Resource Monitor." Click it! This is probably the most common and quickest way to access it.
• Using the Search Bar: Click on the Windows search bar (next to the Start button) and type "Resource Monitor." The app should appear in the search results. Click on it to launch it. Simple as that!
• Via the Run Dialog: Press Windows Key + R to open the Run dialog box. Type "resmon" (without the quotes) and press Enter. This is a quick and efficient method for keyboard enthusiasts.
Understanding the Resource Monitor Interface
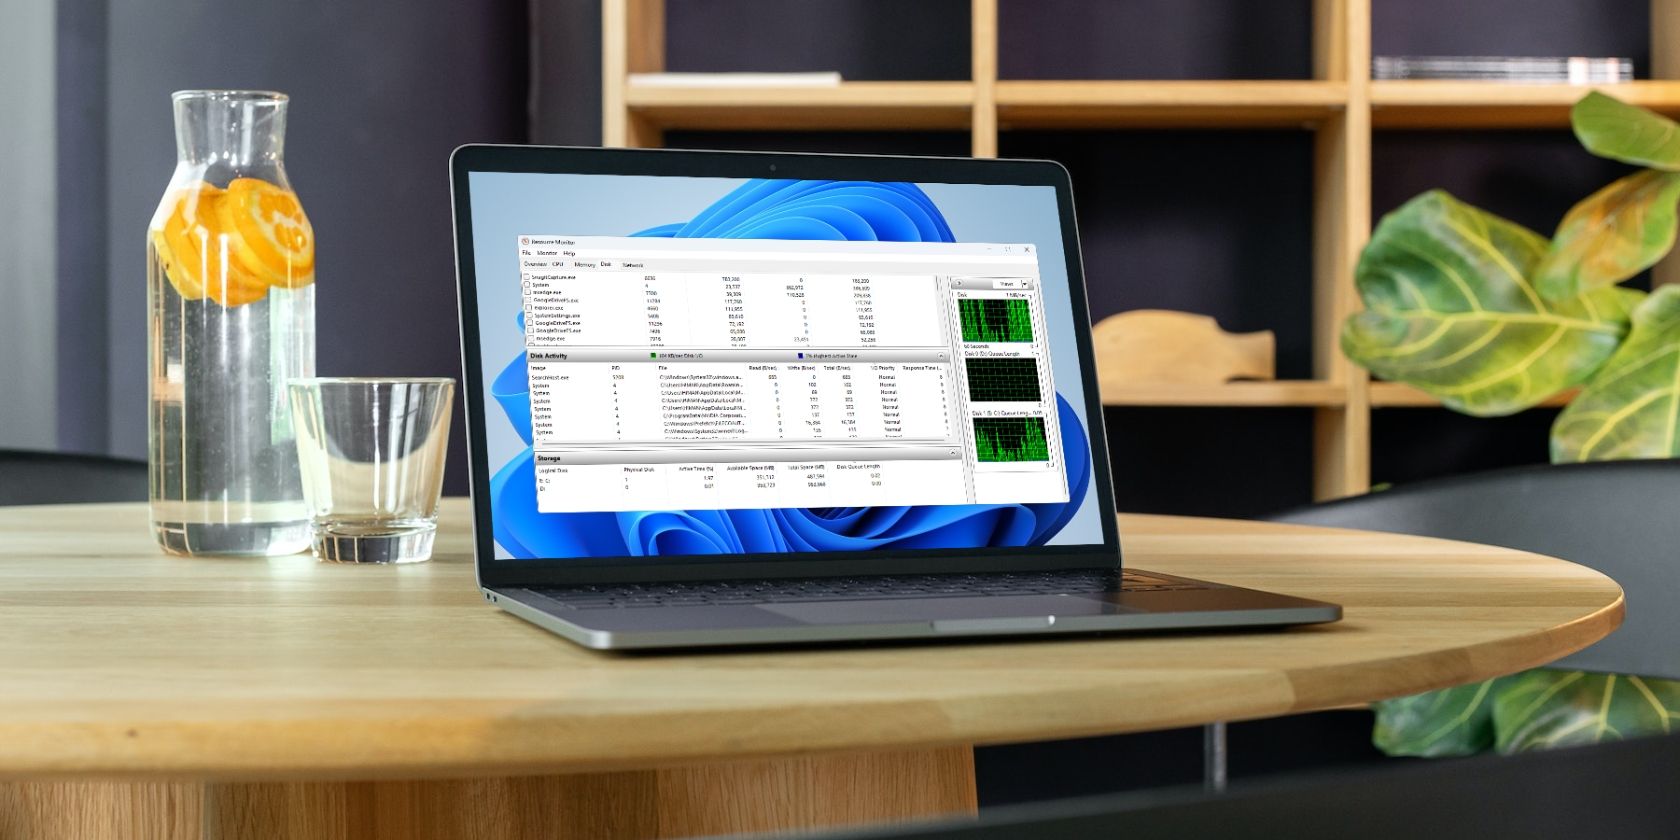
Now that you've launched the Resource Monitor, let's take a look at its interface. It's divided into five main tabs, each focusing on a specific aspect of your system's performance:
• Overview: This tab provides a high-level overview of your CPU, memory, disk, and network usage. It shows real-time graphs of each resource, giving you a quick snapshot of your system's overall health. Think of it as the "vital signs" monitor for your PC.
• CPU: This is where you can delve into the details of your CPU usage. It shows a list of all running processes and their CPU utilization. You can identify which programs are hogging your CPU and causing slowdowns. This is your go-to tab for diagnosing CPU-related performance issues.
• Memory: This tab focuses on your RAM (Random Access Memory). It shows how much memory is being used, how much is free, and how memory is allocated to different processes. It's essential for identifying memory leaks or situations where your system is running out of memory.
• Disk: This tab provides information about your hard drives and solid-state drives (SSDs). It shows which processes are accessing your disks, how much data is being read and written, and the disk queue length. It's helpful for identifying disk bottlenecks that are slowing down your system.
• Network: This tab monitors your network activity. It shows which processes are using your network connection, how much data is being sent and received, and the network latency. It's useful for identifying network-related performance issues, such as slow downloads or high ping times.
Analyzing CPU Usage
The CPU tab is your first stop when troubleshooting performance issues. Here's how to get the most out of it:
• Identifying CPU-Hungry Processes: The CPU tab lists all running processes and their CPU utilization. Sort the list by the "CPU" column (click on the column header) to see which processes are using the most CPU resources. If you see a process consistently using a high percentage of CPU, it might be the culprit behind your slowdowns.
• Understanding System Processes: Be aware that some system processes, like "System Idle Process," will always show a high CPU usage. This is normal; it simply means that the CPU is idle and waiting for instructions. Don't panic if you see this!
• Investigating Unknown Processes: If you see a process you don't recognize, do some research. Google the process name to find out what it is and whether it's legitimate. It could be malware or a program you no longer need.
• Ending Problematic Processes: If you've identified a process that's hogging your CPU and you're sure it's not essential, you can end it from the Resource Monitor. Right-click on the process and select "End Process." Be careful when ending processes, as you could potentially crash your system or lose data. Only end processes you're confident are safe to terminate.
• Analyzing Threads: Expand a process to see its individual threads. Each thread represents a separate unit of execution within the process. Analyzing threads can help you pinpoint which specific part of a program is causing the high CPU usage. This is more advanced, but it can be useful for developers and experienced users.
Monitoring Memory Usage
The Memory tab is crucial for understanding how your system is using its RAM. Here's how to interpret the data:
• Understanding Memory Allocation: The Memory tab shows how your memory is allocated into different categories: "Hard Faults/sec," "Commit Charge," "In Use," "Modified," "Standby," and Free.Understanding these categories can help you diagnose memory-related issues.
• Identifying Memory Leaks: A memory leak occurs when a program allocates memory but fails to release it properly. Over time, this can lead to your system running out of memory and slowing down. Look for processes that are gradually consuming more and more memory over time. If you notice a process steadily increasing its memory usage, it might be a sign of a memory leak.
• Checking for High Hard Faults/sec: Hard faults occur when your system needs to access data that's stored on your hard drive because it's not available in RAM. A high number of hard faults per second indicates that your system is running out of memory and is constantly swapping data between RAM and the hard drive. This can significantly slow down your performance.
• Closing Unnecessary Programs: If you're running low on memory, close any programs you're not currently using. This will free up memory and improve your system's performance. Web browsers, especially with many tabs open, are notorious memory hogs.
• Considering a RAM Upgrade: If you consistently experience high memory usage and hard faults, consider upgrading your RAM. More RAM will allow your system to store more data in memory, reducing the need to access the hard drive and improving performance.
Investigating Disk Activity
The Disk tab helps you identify disk bottlenecks that can slow down your system. Here's what to look for:
• Identifying Disk-Intensive Processes: The Disk tab lists all processes that are accessing your disks and the amount of data being read and written. Sort the list by the "Read (B/sec)" or "Write (B/sec)" columns to see which processes are using the most disk resources.
• Checking Disk Queue Length: The disk queue length indicates the number of requests waiting to be processed by the disk. A high disk queue length (typically above 2) suggests that your disk is overloaded and is struggling to keep up with the demand. This is a common sign of a disk bottleneck.
• Defragmenting Your Hard Drive: If you're using a traditional hard drive (HDD), defragmenting it can improve its performance. Defragmentation reorganizes the files on your hard drive, making it easier for the system to access them. Windows has a built-in defragmentation tool that you can use. Note: Defragmentation is not necessary for solid-state drives (SSDs) and can even reduce their lifespan.
• Considering an SSD Upgrade: If you're still using a traditional hard drive, consider upgrading to a solid-state drive (SSD). SSDs are significantly faster than HDDs and can dramatically improve your system's performance. They have no moving parts, making them much faster at accessing data.
• Monitoring Disk Latency: High disk latency (the time it takes for the disk to respond to a request) can also indicate a disk bottleneck. The Resource Monitor doesn't directly display disk latency, but you can use other tools, such as the Performance Monitor, to track this metric.
Analyzing Network Activity
The Network tab helps you identify network-related performance issues. Here's what to look for:
• Identifying Network-Hungry Processes: The Network tab lists all processes that are using your network connection and the amount of data being sent and received. Sort the list by the "Send (B/sec)" or "Receive (B/sec)" columns to see which processes are using the most network resources.
• Checking Network Latency: Network latency, also known as ping time, is the time it takes for data to travel between your computer and a remote server. High latency can cause slow downloads, lag in online games, and other network-related problems. The Resource Monitor shows the latency for each process.
• Closing Unnecessary Network Connections: If you're experiencing network slowdowns, close any programs that are using your network connection unnecessarily. Streaming services, online games, and file-sharing programs can consume a lot of bandwidth.
• Checking Your Internet Connection: If you're consistently experiencing high network latency or slow download speeds, check your internet connection. Run a speed test to see if you're getting the speeds you're paying for. Contact your internet service provider (ISP) if you suspect a problem with your connection.
• Monitoring TCP Connections: The TCP Connections section of the Network tab shows a list of all active TCP connections on your system. This can be useful for identifying suspicious connections or programs that are communicating with unknown servers.
Real-World Examples
Let's look at a few real-world scenarios where the Resource Monitor can come in handy:
• Slow Game Performance: You're playing your favorite game, and it's stuttering and lagging. Open the Resource Monitor and check the CPU and GPU usage. If your CPU is maxed out, try closing other programs or lowering the game's graphics settings. If your GPU is the bottleneck, consider upgrading your graphics card.
• Slow Web Browsing: Web pages are loading slowly. Open the Resource Monitor and check the Network tab. If you see high network latency or a process consuming a lot of bandwidth, try closing unnecessary programs or checking your internet connection.
• System Freezes: Your system freezes up unexpectedly. Open the Resource Monitor (if you can) and check the CPU, memory, and disk usage. If any of these resources are maxed out, it could be the cause of the freeze. Try ending the problematic process or restarting your system.
• Identifying Malware: You suspect your system is infected with malware. Open the Resource Monitor and look for processes you don't recognize or that are consuming a lot of resources. Google the process name to see if it's legitimate. If you suspect malware, run a scan with your antivirus software.
By understanding how to use the Windows 10 Resource Monitor, you can gain valuable insights into your system's performance and troubleshoot issues more effectively. It's a powerful tool that every Windows user should be familiar with.
Questions and Answers
Here are some common questions and answers related to the Windows 10 Resource Monitor:
• Question: Is the Resource Monitor safe to use? Can I accidentally damage my computer by using it?
Answer: Yes, the Resource Monitor is completely safe to use. It's a read-only tool, meaning you can't accidentally change any system settings or damage your computer by simply opening and viewing the data. However, be cautious when ending processes, as ending essential system processes can cause instability or data loss.
• Question: Does the Resource Monitor slow down my computer?
Answer: The Resource Monitor itself consumes very few resources and has a negligible impact on your system's performance. You can leave it open without worrying about it slowing down your computer.
• Question: Can I use the Resource Monitor to monitor the performance of a specific program?
Answer: Yes, you can use the Resource Monitor to monitor the resource usage of a specific program. Simply find the program in the list of processes and observe its CPU, memory, disk, and network usage. This can help you identify if the program is causing any performance issues.
• Question: Are there any alternatives to the Windows 10 Resource Monitor?
Answer: Yes, there are many alternative performance monitoring tools available, both free and paid. Some popular alternatives include: Task Manager (which is simpler but less detailed), Performance Monitor (more advanced and customizable), Process Explorer (a powerful tool for advanced users), and various third-party system monitoring utilities.
These tools offer similar functionality to the Resource Monitor, but they may have different features, interfaces, and levels of complexity. The best tool for you will depend on your specific needs and technical expertise.
We've reached the end of our deep dive into the Windows 10 Resource Monitor! I hope you've found this guide helpful and that you're now equipped with the knowledge and skills to analyze your system's performance like a pro. We covered everything from accessing the Resource Monitor to understanding its interface, analyzing CPU, memory, disk, and network usage, and even looked at some real-world examples. Remember, the Resource Monitor is your secret weapon against sluggishness, helping you identify bottlenecks, troubleshoot issues, and optimize your system for peak performance.
Now that you're armed with this knowledge, I encourage you to open the Resource Monitor on your own Windows 10 machine and start exploring! Don't be afraid to experiment and see what you can discover. The more you use it, the more comfortable you'll become with its interface and the more valuable insights you'll gain into your system's inner workings. And who knows, you might even impress your friends and family with your newfound tech skills!
So, go forth and conquer those performance issues! Are you ready to unlock the full potential of your Windows 10 PC?
Post a Comment for "How to Use the Windows 10 Resource Monitor: Analyze System Performance"
Post a Comment